

JohnLM
-
Content Count
359 -
Joined
-
Last visited
Posts posted by JohnLM
-
-
I like the IDE the way it is. I hope they did not change it to something completely different.
For example, I like the way you can scroll via cursor up/down keys and not have the caret pinned to the end of the line.
-
 1
1
-
-
During the 2/14 Delphi 30th Anniversary webinar, I recall Ian did barely mention a 12.3 was coming, so I would guess that will be the next release.
-
Well, it's quits for this aoc2019/day10 puzzle.
As has turned out, this was a math puzzle, requiring Trignometry and other science/math-related knowledge which I do not have. There is no way I can do this, especially part 2, which is well over my head. Actually, I searched for and watched several YT videos on the aoc2019/day10 puzzle, mainly to find out if someone would go into details relating to my questions. And some of the details vaguely answered my questions, but enough for me to realize that this was not for using with the last "square" grid I posted but was for much finer x,y points in space and requiring higher levels of math/trig, etc.. Thus, this was way over my head. The language used in those videos were in Rust, Python, and some other that I never heard of. But I don't look at them for the source code. I mainly watch them for additional details and explanations of the puzzles which I needed for this puzzle. Anyway, at least I gave it a shot.
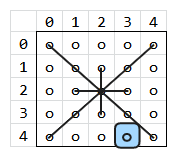
As for that last grid <<2nd image>> in my previous post, I'm going to keep that as a reference to help me build some functions for searching through them. I have the feeling that they will come in handy in future puzzles and other endeavours.
-
Okay, so back to the original question from page 2.
I have made some updates to the grid, below.
The red lines are where the puzzle said it was blocked by [2,2] (where you see the red square).
To me, it appears that location [4,0] (the orange line) would be one of the Asteroids in view. But I'm not so sure. see 2nd image below this one.
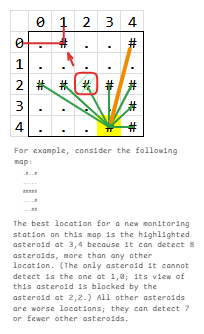
<< 1st image >>
My question was which coordinate is the 8th asteroid?
Q1- is it [4,0] - orange line?
Q2- or is it [3,4] - the yellow highlighted cell? It has a '#' in it, per the example on 2019/Day10 puzzle.
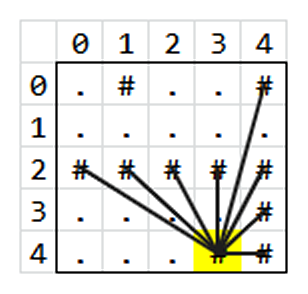
Given this 2nd image I custom made to help explain my understanding of direction(s) of travel. Note, I have now updated the squares to be more evenly and uniformatly placed visually. This should help to guide the direction of paths one can travel in more precise I think. Thus, it is clear to me that [4,0] can not be one of the 8 asteroids. Also, most of the others as well. Only a few will travel and be detected, per the coordinates (the lines) I have shown, below.
<< 2nd image >>
I have more to say, but I am out of time and very late for work.
-
Oh, how clumsy of me. I was aiming for {ch:=s[c]; and then {if ch='#' then}, . . . but realized I could use {if s[c]='#' then} and didn't remove the other code.
And still, your idea (technique) is better.
function astCounterGrid1(m1: tmemo): integer;
var
  r,c : integer;
  aC: integer;
  s : string;
begin
  aC:=0; result:=0;
  for r:= 0 to m1.Lines.Count-1 do begin
    s := m1.Lines.Strings[r];
    for c:=0 to length(s) do
      if s[c]='#' then inc(aC);
  end;
  result := aC;
end; // me; my updated version
Below, is CorneliusDavid suggestion, plus I added the capture for #13#10 end-of-line codes (when used in tmemo as a grid).
function astCounterGrid2(m1: tmemo): integer;
var
  aC: integer;
  s : string;
begin
  aC:=0; result:=0;
  s := m1.Text;
  s := StringReplace(s, #13#10, '', [rfReplaceAll]);
  s := StringReplace(s, '.'   , '', [rfReplaceAll]);
  Inc(ac, s.Length);
  result := aC;
end; // carnelious suggestion and my updates
Both routines produce the same results. They capture the total asteroid counts for all the examples:
Best is 3,4 because it can detect 8 asteroids : had 10
Best is 5,8 with 33 other asteroids detected: had 40
Best is 1,2 with 35 other asteroids detected: had 40
Best is 6,3 with 41 other asteroids detected: had 50
Best is 11,13 with 210 other asteroids detected: had 300
I often use the tmemo component as a "grid" to help me with visualization, though it does add to the extra work to compensate for it, like when accounting for the #13#10 char codes that are added.
Had I used an multi-dimentional array[1..5, 1..5] of char, then the #13#10 would not be there and we could eliminate the line with:
s := StringReplace(s, #13#10, '', [rfReplaceAll]);-
 1
1
-
-
Okay, I got the counter working finally. I should have taken this route, as I knew it was the easiest method to do but I wanted to do it a better way (I thought would be more than one way--I'm sure there is) and that just took me to many dark places. I don't know the tricks and techniques you all know. So... at least I can count chars. And as for the reason why I wanted to count them-the asteroids? Well, just because I wanted to know how many there were in the examples that 2019/Day-10 had shown.
function astCounterGrid(m1: tmemo): integer; var r,c : integer; aC : integer; // asteroid counter; s : string; ch : char; begin aC:=0; result:=0; for r:= 0 to m1.Lines.Count-1 do begin s := m1.Lines.Strings[r]; for c:=0 to length(s) do begin ch:=s[c]; if s[c]='#' then inc(aC); end; end; result := aC; end; procedure TForm1.btnCountAsteroidsClick(Sender: TObject); begin edit1.text := astCounterGrid(memo1).ToString; end; -
I didn't realize I was still in 2019. I mean, I must have been browsing in it some time ago and forgot, and randomly selected a day to have a looksees. Oh well. Now, I've invested time in it and was in the middle of counting the asteroids in the examples they listed. So I was creating a counter and had trouble with it up to now. Still at it. I'm very slow. My brain is fried. Anyway, I'm in the middle of debugging that code when you guys were posting. Oh, and but the question(s) still remain, LoL. . .
-
Oh my gosh. Appoligies. I thought I was in 2024 but somehow selected 2019 and didn't realize it !!!
-
1
-
-
Okay, by now, I know this topic is old, but whatever.
I had a look at the Day-10 puzzle and I'm a bit confused with how they are detecting the asteriods.
The following example grid is given as:
.#..#
.....
#####
....#
...##
Then, it says the following:
The best location for a new monitoring station on this map is the
highlighted asteroid at 3,4 because it can detect 8 asteroids, more than
any other location. (The only asteroid it cannot detect is the one at 1,0;
its view of this asteroid is blocked by the asteroid at 2,2.)
..and goes on to say [2,2] is blocking [1,0].
Q1) So how come it does not say [4,0] is blocked by [3,2] or [4,2]?
Q2) Where is the 8th asteroid? Is it counting itself as an asteroid?
I drew the following grid in MS Excel and then pasted it into the website, Excalidraw and drew some lines to connect the asteroids.
I have follow-up questions as to the other examples they give, but I will wait at first.
-
Another update. . . solved!!
Okay. I believe I have resolved the issue with getting the debugger working in projects with Pytho4Delphi.
My particular issue was with having a TFrame in the Python4Delphi project. I had it as a 32-bit, while the main app was 64-bit. And, when I changed both to 32-bit and recompiled via "Build-All Projects", then the debugger would work. If I had just only did a regular compile, the debugger would not work.
Note, but still no debugger for 64-bit apps. I did not know this was the case for XE7 because most my apps were 32-bit. Oh well.
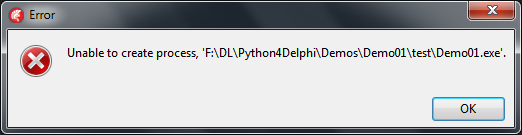
-
Delphi XE7 -- After some further investigation and research, it turns out that the debugger is not active in *any* 64-bit VCL and FMX applications. I have the same error message shown in my first post, shown in the second image. Only 32-bit apps have debugging working. But the issue with the 32-bit debugging indicated in the previous post, 3rd example, is a separate issue with the P4D, I guess.
-
Specs: Delphi XE7, VCL, Win7, Python4Delphi v3.8.10 (the last official build for windows 7)
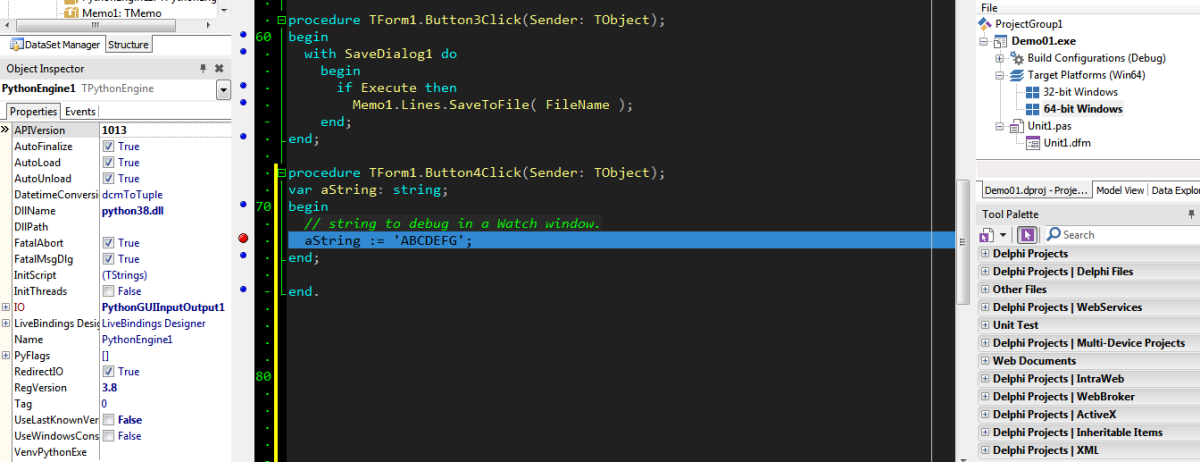
In one of my projects that includes P4D, I discovered that I can not debug the code. Note, I am not debugging the Python aspects, just the Delphi code only, such as when you put a breakpoint at the line aString="ABCDEFG", as seen below. Note also, that I am giving a simplified example, (where you see the breakpoint) just to show the issue.
Note: this is for any projects that include Python4Delphi.

And the final result after pressing F9 (compile with debug). . .

And, when I switch to 32-bit target and compile via F9, I get the following different issue:
[dcc32 Fatal Error] Demo01.dpr(7): F2048 Bad unit format: 'Unit1.dcu' - Expected version: 28.0, Windows Unicode(x86) Found version: 28.0, Windows Unicode(x64)I do not know how to resolve this. I would like to do some debugging in my P4D projects but can't.
Any advice would be greatly appreciated, thanks!
-
Update on this endeavour. . . success !!
Wow! What a pain in the legs, searching the web and trying to debug and resolve this issue. But I am very happy to say that I can now import and use Pandas, Numpy, and other libraries, including graphing and what-not, using my micro IDE for Python app.
-
update on this issue. . . not resolved.
This issue must be related to the older version (3.8.10) and Windows 7, not to mention the different updates made to the packages over time.
I went to the website you linked to and have been going through the steps, (plus doing other research of my own). And I have not been able to get these steps working.
For example:
1. python -m venv c:\myenv # i decided to make it easier to navigate to, so I made the folder at the c:\ root instead.
2. Then, activate the virtual environment:
2b. source myenv/bin/activate <-- does not workThere is no program called source. But, after a while I came to realize that maybe they are saying to CD over into the folder? ..in order to use PIP and Python.exe
Anyway. That folder does not exist in step 2b. It is called myenv/scripts/ and all the .exe files are in there.
I will come back to this an try to figure out how to redirect the PATH to the myenv folder so I can run test via my app. Or else I will have to figure a way to rename the folders temporarely. I got the folder renamer working. I Just have to do some additional hacks to get it to "swap" back and forth once I figure out the issue with the numpy part. So, if I want my ide 4 python to work with the myenv/script folder, I will have to swap the original Python folder and myenv/script folder.
This is the method that I started working first instead of figuring out how to change the env PATH string. I don't know. I'm not knowledge in Python and all its trouble-shooting, so I am hacking. okay. am late for work. will give an update later.
-
Update on this endeavor. . .
I believe I have properly installed all the necessary libraries as mentioned in my first post. However, I seem to be having trouble with Python4Delphi issuing the following error due to some issue with this library in this line: "import matplotlib.pyplot as plt"
AttributeError: partially initialized module 'numpy' has no attribute
'__version__' (most likely due to a circular import)
and the full errors as reported by Python4Delphi:
python script:

import matplotlib.pyplot as plt
import numpy as np


Python run output results:

Traceback (most recent call last):
  File "<string>", line 1, in <module>
  File "C:\Users\dell\AppData\Local\Programs\Python\Python38\lib\site-packages\matplotlib\__init__.py", line 255, in <module>
    _check_versions()
  File "C:\Users\dell\AppData\Local\Programs\Python\Python38\lib\site-packages\matplotlib\__init__.py", line 250, in _check_versions
    if parse_version(module.__version__) < parse_version(minver):
AttributeError: partially initialized module 'numpy' has no attribute '__version__' (most likely due to a circular import)
I am trying to learn how to produce charts and graphs, like you can do in Excel. I have tried several different lessons that use import libraries and so far, the only library giving me trouble is "matplotlib.pyplot".
I am failing miserably in this Python4Delphi endeavor!! Does anyone here know how I can resolve this?
-
Apparently, I did have v3.8.10 installed, but the installation must have missed some things I did not tick at the time of initial installation.
I proceeded to uninstall it and reinstall it and making sure I tic the part about adding it the search path.
Afterwards, the installation went successfully and I type in PIP and the process worked.
Below is a run-through of the process for the command line: PIP install pandas
C:\Users\dell>pip install pandas
Collecting pandas
  Downloading pandas-2.0.3-cp38-cp38-win_amd64.whl (10.8 MB)
     |████████████████████████████████| 10.8 MB 1.3 MB/s
Collecting python-dateutil>=2.8.2
  Downloading python_dateutil-2.9.0.post0-py2.py3-none-any.whl (229 kB)
     |████████████████████████████████| 229 kB 1.7 MB/s
Collecting numpy>=1.20.3
  Downloading numpy-1.24.4-cp38-cp38-win_amd64.whl (14.9 MB)
     |████████████████████████████████| 14.9 MB 1.6 MB/s
Collecting pytz>=2020.1
  Downloading pytz-2025.1-py2.py3-none-any.whl (507 kB)
     |████████████████████████████████| 507 kB 1.3 MB/s
Collecting tzdata>=2022.1
  Downloading tzdata-2025.1-py2.py3-none-any.whl (346 kB)
     |████████████████████████████████| 346 kB 1.3 MB/s
Collecting six>=1.5
  Downloading six-1.17.0-py2.py3-none-any.whl (11 kB)
Installing collected packages: six, tzdata, pytz, python-dateutil, numpy, pandas

Successfully installed numpy-1.24.4 pandas-2.0.3 python-dateutil-2.9.0.post0 pyt
z-2025.1 six-1.17.0 tzdata-2025.1
WARNING: You are using pip version 21.1.1; however, version 25.0 is available.
You should consider upgrading via the 'c:\users\dell\appdata\local\programs\pyth
on\python38\python.exe -m pip install --upgrade pip' command.

C:\Users\dell>
I am not sure that it installed in the correct place. I mean, I did not give it a folder/path name. I just opened a comand line prompt via CMD and the default folder showed, thus, c:\users\dell
I am not a Python guru. Can anybody confirm that I performed this operation correctly?
-
Thanks. Okay, I found the last version of Python being made for Windows 7 is v3.8.10 - After that version, only Windows 10 and onward - 😞
link --> https://www.python.org/downloads/release/python-3810/
download link 64b --> https://www.python.org/ftp/python/3.8.10/python-3.8.10-amd64.exe
download link 32b --> https://www.python.org/ftp/python/3.8.10/python-3.8.10.exe
-
pip is not on my machine. I searched around for it. Also, after some time searching some more, I found out how to tell which version of Python I have installed, which is currently at version 2.7.9rc1 and I must have installed it back in 2014 since the date of the folder "Python27" shows that year it was created. To the best of my memory, I got interested in it when I heard about and watched a youtube video on Python4Delphi by Jim Mckeeth and I must have installed to try it out back then and then forgot about it until around now. But the version I have seems to work fine, and I've tried many lessons successfully. Just basic stuff. But now I want to get into it more deeper.
Oh, and I searched around for "pandas" or a folder at least, and I did not find any. It looks like I have a bit of research to do.
-
Specs: Delphi XE7, VCL, Win7 64Bit - current version of Python v2.7.9rc1 as of today 2/1/2025 Friday -- edit: will update it to latest for win7, to v3.8.10
As part of my learning of Python and using Python4Delphi as the learning real-time GUI tool, I came across a youtube tutorial video where the person was calling the following Import libraries:
import pandas as pd
import matplotlib.pyplot as plt
import networkx as nx
In other learning python projects I have imported some libraries successfully. The ones above are not avail on my laptop. So I am guessing that I have to download them.
1. Where can I download them from?
2. and where (hdd folder) do I download them to on my laptop?
Please note: that I am not using any official Python IDE GUI app. I am using Python4Delphi and building a small IDE for it and am using that as the IDE GUI app to run python code and/or test and run python lessons with.
-
After loading the project into Delphi 12.2, the issue is still present. And setting Doublebuffered=true resolves it.
Note, these are win32 bit app.
-
12 minutes ago, JohnLM said:I should probably test and see because now I am curious.
I am confirming that the issue is also reproducible under Windows 10. I copied the XE7 compiled app over to a usb flash drive and inserted in my Win10 tablet and ran three versions: debugged/released gave issue while the app with dubblebuffered=true gave no issues. Again, the app was developed under Win7/XE7.
Next, I will bring the whole project source code over to the Win10/D12.2 tablet and recompile to see if the issue is still present.
-
Remy, I am not sure that this issue is in other OS's. My main development system is still Windows 7 and Delphi XE7, though I do have a Win10 laptop with D11.2 and a Win10 tablet with D12.2 but I have never developed projects utilizing the Listview for those OS's/Devices to date. But Win7/XE7 is what I use daily. I very rarely use Windows 10, and never have Win11. I don't even have any devices with Win11. Anyway. All apps I create are under Win7. Maybe the issue does not exist in Win10/11? and/or with D11/12+?
I should probably test and see because now I am curious.
-
Update on the issue with the Listview artifacts. . .
This has been resolved by setting Doublebufferd to true.
And now for the checkboxes.
-
Remy - no, I am not.
I believe it has to do with Rowselect set to True.
1) When I move the mouse around to select a row, the last selected row leaves residual "vertical" outlines of the edges. And, if I just move the mouse cursor across them all (without clicking anywhere on the Listview it will remove the artifacts.
2) When it is set to False, there is no artifacts. Only one cell is highlighted and clean. But I prefer the whole row to show as highlighted when scrolling up/down or clicking into it.
So far, I've tried removing the Listview and adding a new one with default criteria and only changing the ownerDraw to True. But no difference. Still shows artifacts.
And the Checkboxes no longer show. I'm investigating that as well.
12.3 or 13/14 as next?
in Delphi IDE and APIs
Posted
A feature request I would love to see happen is the ability to add a comment to the Open Recent section on the welcome page. And a create/modify date.
I would like to be able to add/change a comment for each of the entries so that I know more details about a project I may have forgotten about. Every time I open a project in XE7, I just keep wishing there was such a feature. And let it be customizable in options or something, like you can do in Explorer where you right-click the labels bar and a drop-down of selections appear to customize the viewing layout.